Intro to ID529: Data Management and Analytic Workflows in R

meet your instructors

Christian Testa (he/him/his)

Hi! I’m Christian Testa 👋 I’ve been a statistical analyst working at the Harvard T.H. Chan School of Public Health for a little over 5 years.

My recent research has focused on addressing health disparities and inequities in the US.

These days I’m working on projects involving epigenetic aging, multiple types of discrimination, COVID-19, and spatiotemporal methods in epidemiology.

Dean Marengi (he/him/his)

Dean's pic

Hi there! I’m Dean Marengi, a current PhD student in the Department of Environmental Health. I received my MPH in epidemiology from the Harvard T.H. Chan School of Public Health, and have been involved in public health research for over ten years. Broadly, I am interested in studying the relationship between prenatal environmental exposures and the subsequent development of neuropsychiatric outcomes.

I’m a self-taught R programmer who is very enthusiastic about data cleaning, and even more enthusiastic about helping others learn how to clean their data!

Amanda Hernandez (she/her/hers)

Amanda's pic

Hi! I’m Amanda Hernandez and I’m a second year Masters student in Environmental Health. My work is at the intersection of environmental geochemistry + public health, focused on addressing environmental health disparities through community-based participatory research and evidence-based decision-making.

I’m a self-taught R user, Shiny enthusiast, and advocate for coding in light mode.

Jarvis Chen (he/him/his)

Jarvis's pic

Hi, I’m Jarvis Chen, a Lecturer in Social and Behavioral Sciences at the Harvard T.H. Chan School of Public Health and Associate Director of the PhD Program in Population Health Sciences at the Graduate School of Arts and Sciences. I teach multiple courses in quantitative research methods and I’m passionate about causal inference, methods development, and population health science pedagogy.

I’ve been a self-taught programmer for >25 years 🫠 and I love learning from other people about the different ways we can analyze and understand data.
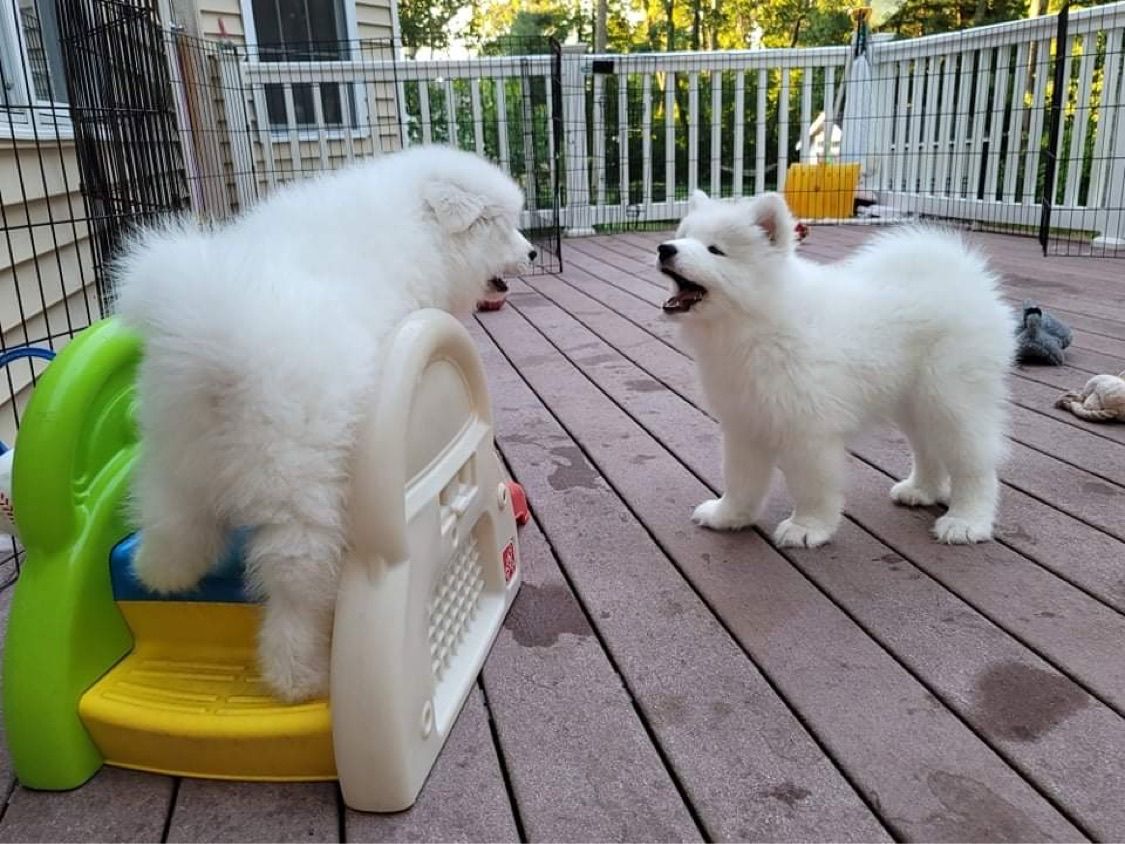
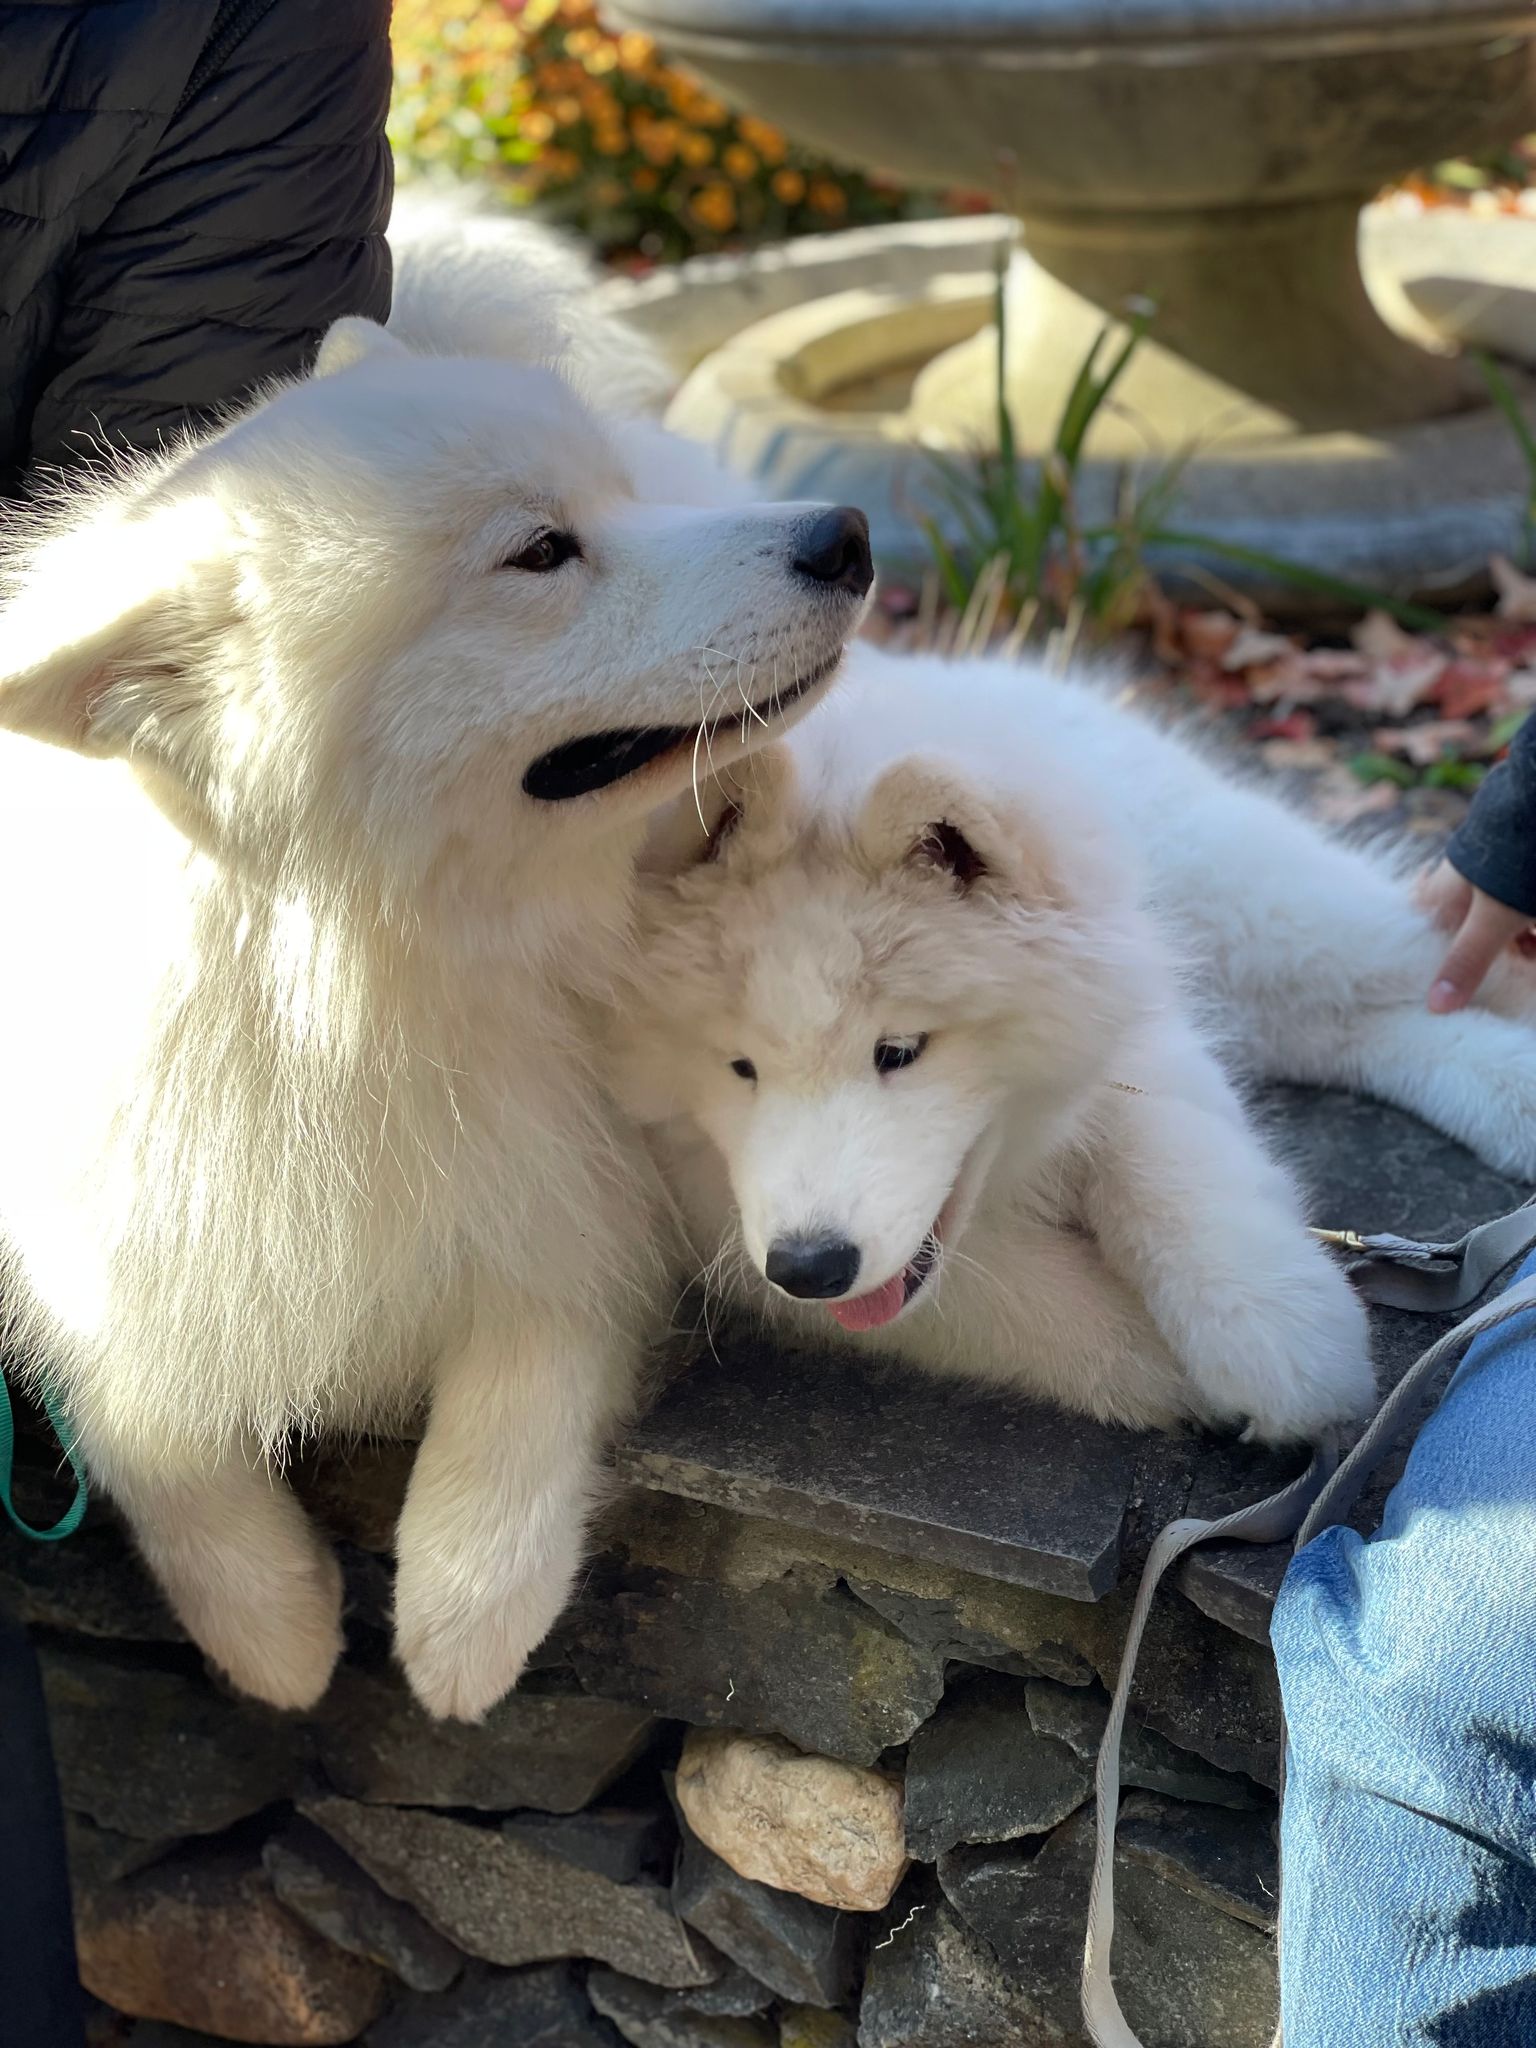
collaborator/co-conspirator/patron

our class mascot

hodu, a white fluffy dog, in a santa hat with a tie

hodu is a 1.5 year old samoyed.

호두 (hodu) means walnut in korean.

he loves dogs, people, and treats.

you will have the chance to meet him friday at 5:30 pm in the courtyard.

course philosophy

our goals


our goal is to give you the roadmap, time, and space you need to grow your R skills.

all our lecture recordings and slides will be online so you can refer back to them as you need to.

some pep talk

It’s easy when you start out programming to get really frustrated and think, “Oh it’s me, I’m really stupid,” or, “I’m not made out to program.” But, that is absolutely not the case. Everyone gets frustrated. I still get frustrated occasionally when writing R code. It’s just a natural part of programming. So, it happens to everyone and gets less and less over time. Don’t blame yourself. Just take a break, do something fun, and then come back and try again later.

—— Hadley Wickham, Chief Scientist at Posit (Formerly RStudio)

course overview

before we dive in, we want to make sure you have a few things in hand:

gif of a golden retriever with the newspaper

key objectives

  • students will learn best practices for data cleaning, management, and project organization in the context of R programming based analyses focused on Population Health Science.
  • reproducibility will be emphasized to teach students both the merits of reproducible workflows as well as how to build and implement them.
  • learning git and github to version control and disseminate code.

key objectives (continued)

  • exploratory data analysis skills including:
    • data visualization
    • working with regression models
    • creating professional reports
  • how to leverage online resources to get help with any R programming challenges.
  • students will get great picture of the spectacular kinds of data analysis they can go on to do!

tracks for the course

keeping in mind that it’s impossible to learn all of r in any short period of time, we want to encourage you to pick a track to focus your energy on the most.

  • Beginner/Novice
  • Data Visualization
  • Data Cleaning/Management and Working with Codebooks
  • Programming and Software Engineering
  • Other Niche Topics in R

That moment when you realize R can be used for basically any statistical analysis you can imagine, shocked pikachu meme

homework

each day will be accompanied by homework assignments that will be distributed and submitted through github.

additionally, we are asking you to do peer reviews on the homework so that:

  1. you benefit from learning how others approached the same problem, and
  2. you practice articulating constructive feedback related to programming in R.

rubric for homework

your homework will be evaluated on the following rubric:

objective/principle percent of grade
does it accomplish the stated goal? is it complete? 25%
is it well documented and commented? 25%
is it transparent and clearly motivated? is it elegant, i.e., not kludgey? 25%
does it incorporate what’s been taught? does it reflect growth? 25%

we really just want to see that you’re learning, growing as a programmer, and using the homeworks to challenge yourself in a healthy, productive way.

a little dog surrounded by lush plants saying this is fine

rubric for peer review

your peer reviews will be evaluated on the following rubric:

objective/principle percent of grade
does it include constructive criticism? 50%
does it include positive feedback (i.e., things you liked about their approach)? 50%

one puppy barking at another who is standing on a platform one puppy barking at another who is standing on a platform

class discussions

throughout the class, we’ll be having several discussion based activities in various formats.

we want to make sure everyone has a chance to shine, so please make sure that you 1) aren’t dominating the discussions and 2) please be aware that your questions are completely welcome in our discussions.

if you would like to prepare for the discussions in advance, make sure to take a look at the syllabus and timetables on our course website for what we’ll be covering in advance.

slack & communication

we’ll be active on the Slack that is linked to through Canvas – we’d love to see you on there, to answer questions for you, and to see you collaborate together. if you are an enrolled (graded) student and have questions you’d like the instructional team to answer, ask in #student-questions. please share fun stuff on the #fun channel — doesn’t have to be course related!

if you have questions that you’d like to ask the instructional team in private, please email all four of us and we’ll reply-all to you so the whole instructional team knows if your question has been answered by another one of us.

recordings

we’ll be recording the lectures (but not discussions) and posting them online so you can refer back to them during the course and after.

covid policy

biobot wastewater data from the Boston area

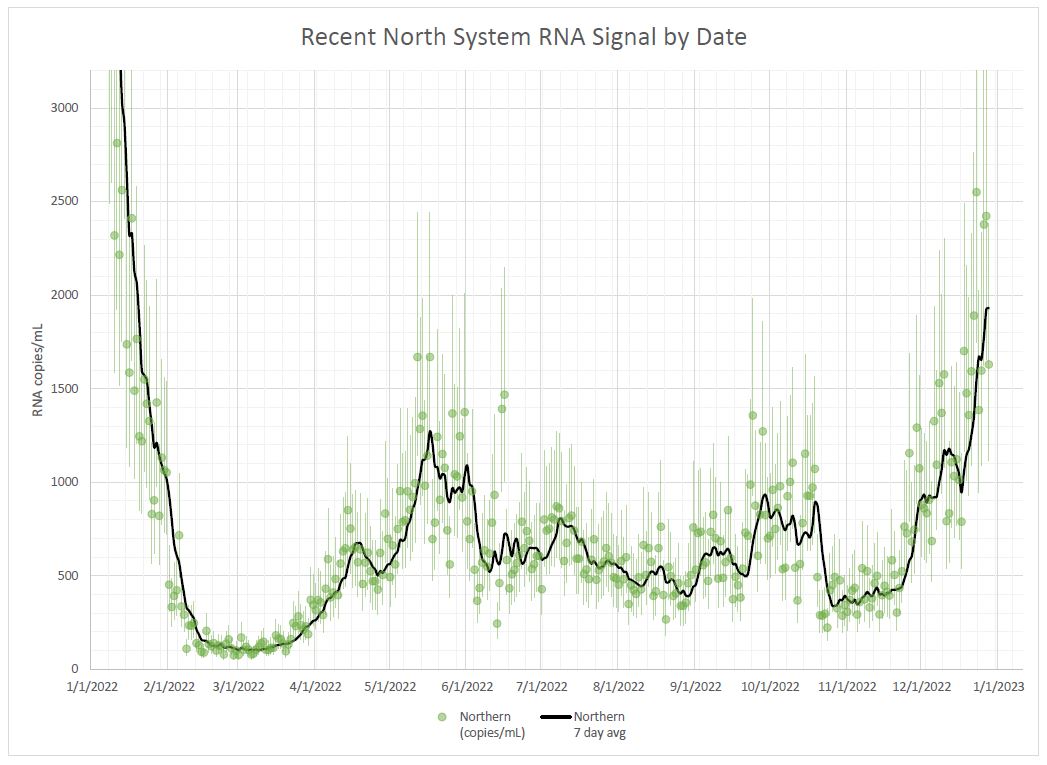
source: https://www.mwra.com/biobot/biobotdata.htm

  • please wear a mask
  • please stay home if you have symptoms / feel sick

time for a live demo 🤞

what are some of the principles that the live demo employed?

enter your questions / thoughts on bit.ly/day1-discussion

  • code makes the analysis repeatable
  • project organization, code hygiene and documentation
  • data visualizations support exploratory data analysis and communicating results
  • ample reliance on tools that are already out there