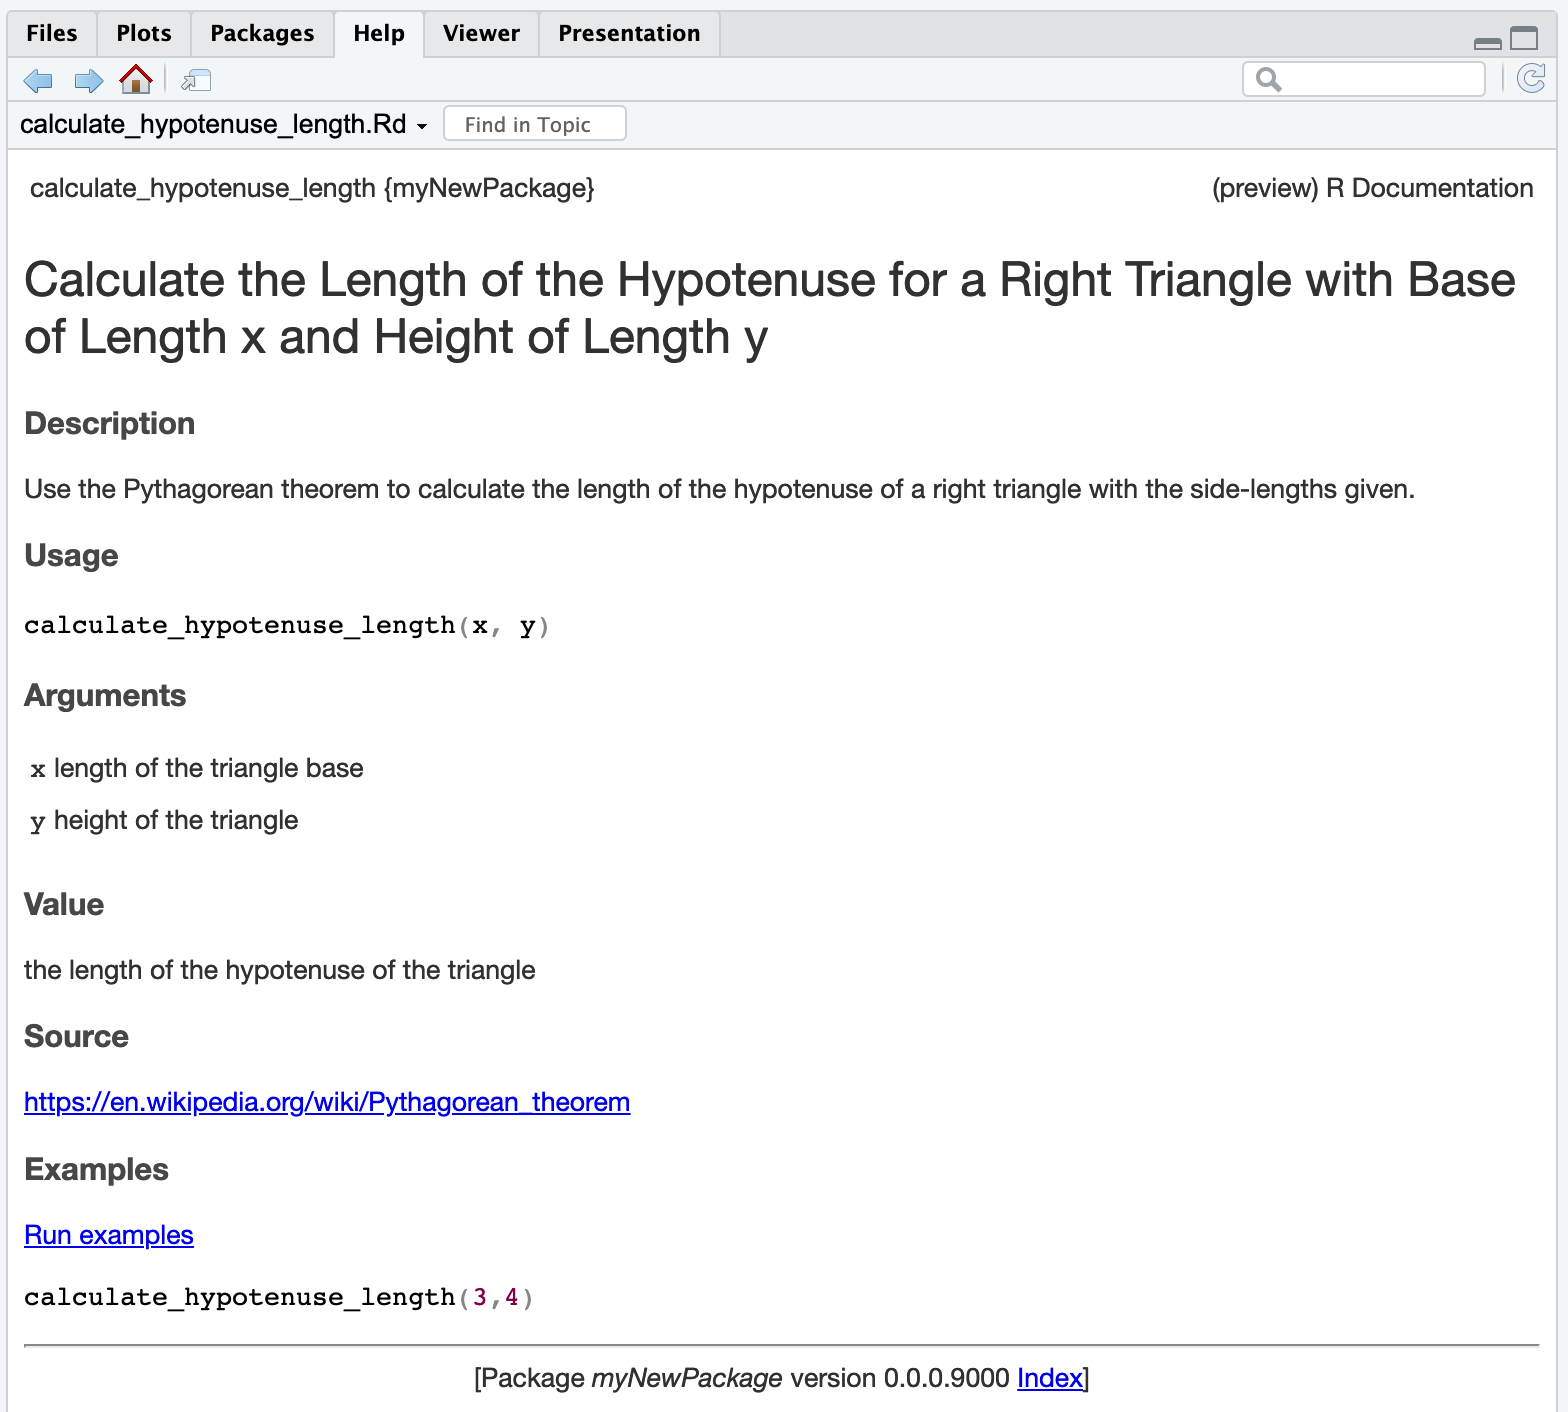
#' Calculate the Length of the Hypotenuse for a Right Triangle with Base of
#' Length x and Height of Length y
#'
#' Use the Pythagorean theorem to calculate the length of the hypotenuse of a
#' right triangle with the side-lengths given.
#'
#' @export
#' @source <https://en.wikipedia.org/wiki/Pythagorean_theorem>
#' @param x length of the triangle base
#' @param y height of the triangle
#' @return the length of the hypotenuse of the triangle
#' @examples
#' calculate_hypotenuse_length(3,4)
calculate_hypotenuse_length <- function(x,y) {
sqrt(x^2 + y^2)
}R Packages
morals
“Software and cathedrals are much the same; first we build them, then we pray.”
—Anonymous
“As a rule, software systems do not work well until they have been used, and have failed repeatedly, in real applications.”
—David Parnas
Packages are [a] fundamental units of reproducible R code. They include reusable R functions, the documentation that describes how to use them, and sample data.
–R Packages, Hadley Wickham and Jenny Bryan
why would i prefer a package [to a regular R project?]
if you have functionality that you want to share, or a dataset that you want to make not just widely accessible and popular, then a package will reduce the friction in doing so.
parts of an R package
- code in the
R/folder - a
DESCRIPTIONfile that describes the package, its dependencies, its license, its authors, etc. - (possibly) built-in data in the
inst/folder (short for installed) - documentation formatted through the
roxygen2system - (optionally, but highly recommended) testing with
testthatin thetests/folder - a
NAMESPACEfile (that is typically generated for you) of which functions and data get exported
lucky for you, devtools and usethis exist
a typical workflow
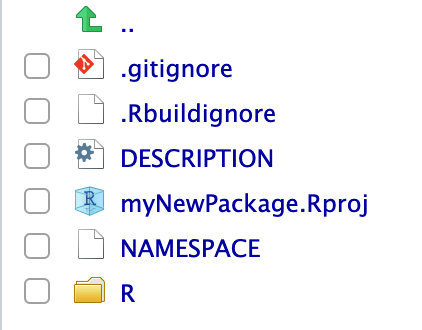
first, make sure you’re in the directory where you want to create your package. then you might run usethis::create_package(path = "myNewPackage"). That’s going to create a new project for you with the boilerplate for a package:
inside DESCRIPTION
Package: myNewPackage
Title: What the Package Does (One Line, Title Case)
Version: 0.0.0.9000
Authors@R:
    person("First", "Last", , "first.last@example.com", role = c("aut", "cre"),
           comment = c(ORCID = "YOUR-ORCID-ID"))
Description: What the package does (one paragraph).
License: `use_mit_license()`, `use_gpl3_license()` or friends to pick a
    license
Encoding: UTF-8
Roxygen: list(markdown = TRUE)
RoxygenNote: 7.2.3
Depends:
  dplyr,
  ggplot2
inside R/
you should put functions and data documentation inside scripts in the R/ folder.
let’s start with a function:
building and installing
devtools::document()
#> ℹ Updating myNewPackage documentation
#> ℹ Loading myNewPackage

devtools::install()
#> ── R CMD build ─────────────────────────────────────────────────────────────────────────
#> ✔  checking for file ‘/Users/cht180/Documents/2023/january/myNewPackage/DESCRIPTION’ ...
#> ─  preparing ‘myNewPackage’:
#> ✔  checking DESCRIPTION meta-information ...
#> ─  checking for LF line-endings in source and make files and shell scripts
#> ─  checking for empty or unneeded directories
#> ─  building ‘myNewPackage_0.0.0.9000.tar.gz’
#>
#> Running /Library/Frameworks/R.framework/Resources/bin/R CMD INSTALL \
#>   /var/folders/m8/2_hpqf1n5g3__1ps7nn8t31r0000gn/T//Rtmp9YBTBz/myNewPackage_0.0.0.9000.tar.gz \
#>   --install-tests
#> * installing to library ‘/Library/Frameworks/R.framework/Versions/4.2-arm64/Resources/library’
#> * installing *source* package ‘myNewPackage’ ...
#> ** using staged installation
#> ** R
#> ** byte-compile and prepare package for lazy loading
#> ** help
#> *** installing help indices
#> ** building package indices
#> ** testing if installed package can be loaded from temporary location
#> ** testing if installed package can be loaded from final location
#> ** testing if installed package keeps a record of temporary installation path
#> * DONE (myNewPackage)
use your package
check the docs
using data in packages
> pythagorean_triples
# A tibble: 16 × 3
a b c
<int> <int> <int>
1 3 4 5
2 5 12 13
3 8 15 17
4 7 24 25
5 20 21 29
6 12 35 37
7 9 40 41
8 28 45 53
9 11 60 61
10 16 63 65
11 33 56 65
12 48 55 73
13 13 84 85
14 36 77 85
15 39 80 89
16 65 72 97
> usethis::use_data(pythagorean_triples)
✔ Setting active project to '/Users/cht180/Documents/2023/january/myNewPackage'
✔ Adding 'R' to Depends field in DESCRIPTION
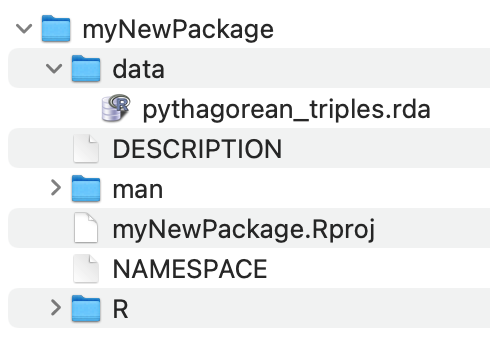
✔ Creating 'data/'
✔ Setting LazyData to 'true' in 'DESCRIPTION'
✔ Saving 'pythagorean_triples' to 'data/pythagorean_triples.rda'
• Document your data (see 'https://r-pkgs.org/data.html')see the data added
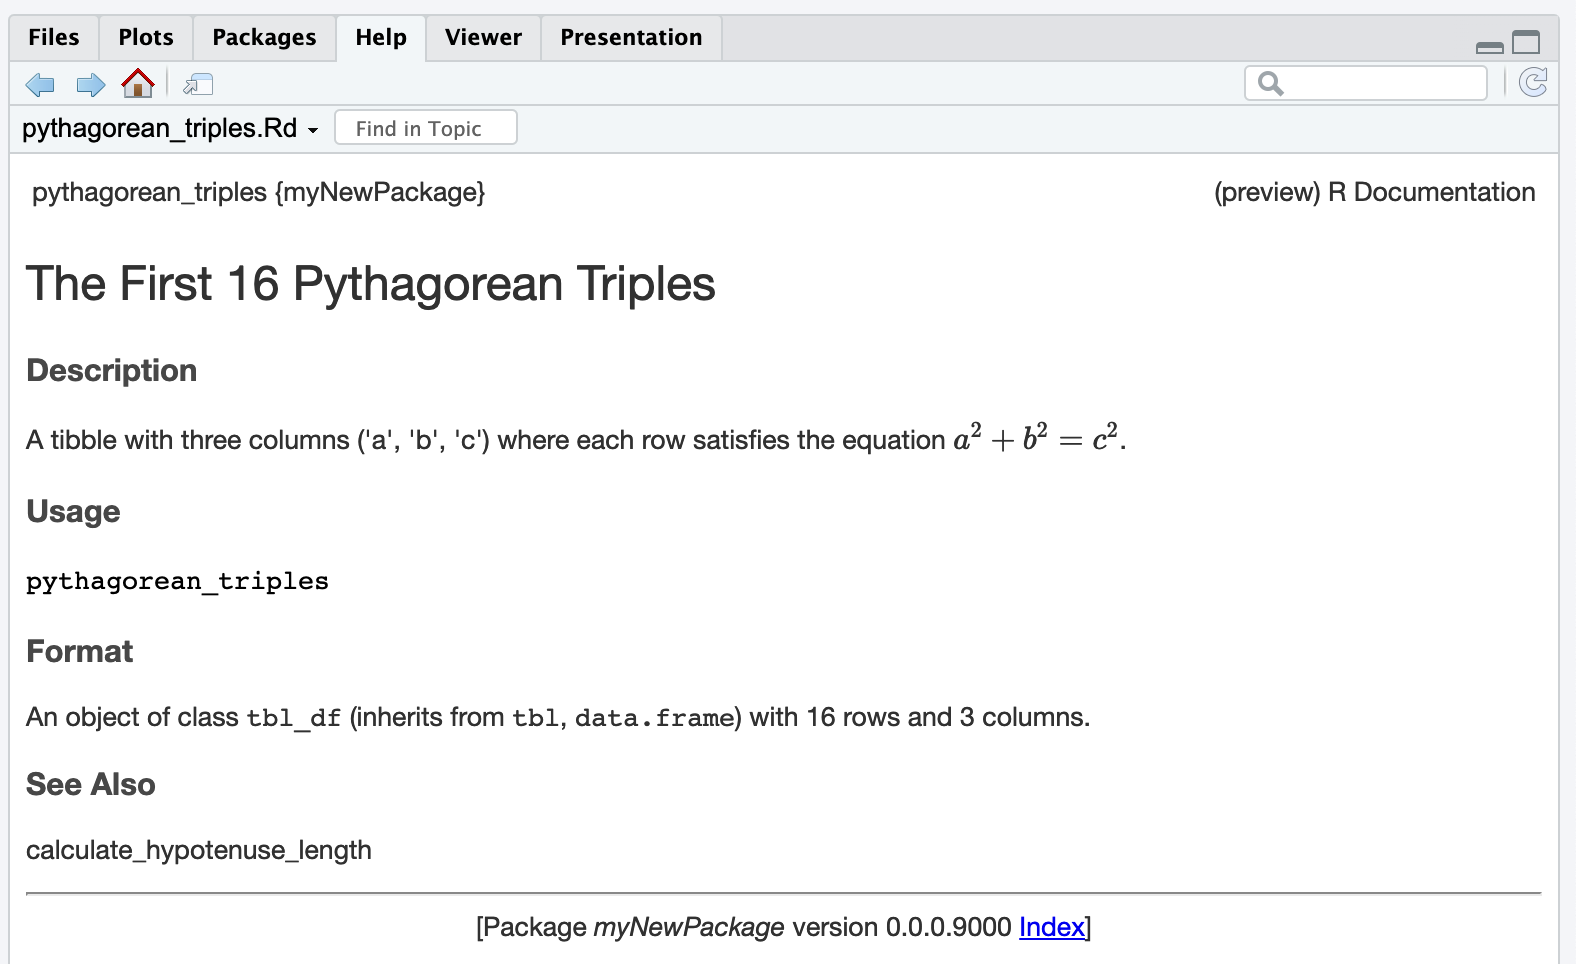
document the data
write a new file: R/pythagorean_triples.R:
document & build again
use your data!
check the docs
vignettes
usethis::use_vignette(name = "basics", title = "Basic Usage of myNewPackage")
#> ✔ Adding 'knitr' to Suggests field in DESCRIPTION
#> ✔ Setting VignetteBuilder field in DESCRIPTION to 'knitr'
#> ✔ Adding 'inst/doc' to '.gitignore'
#> ✔ Creating 'vignettes/'
#> ✔ Adding '*.html', '*.R' to 'vignettes/.gitignore'
#> ✔ Adding 'rmarkdown' to Suggests field in DESCRIPTION
#> ✔ Writing 'vignettes/basics.Rmd'
#> • Modify 'vignettes/basics.Rmd'
edit the vignette
---
title: "Basic Usage of myNewPackage"
output: rmarkdown::html_vignette
vignette: >
  %\VignetteIndexEntry{Basic Usage of myNewPackage}
  %\VignetteEngine{knitr::rmarkdown}
  %\VignetteEncoding{UTF-8}
---

```{r, include = FALSE}
knitr::opts_chunk$set(
  collapse = TRUE,
  comment = "#>"
)
```

```{r setup}
library(myNewPackage)
```
update the vignette
```{r setup}
library(myNewPackage)
library(ggplot2)
library(tidyr)
library(dplyr)
```
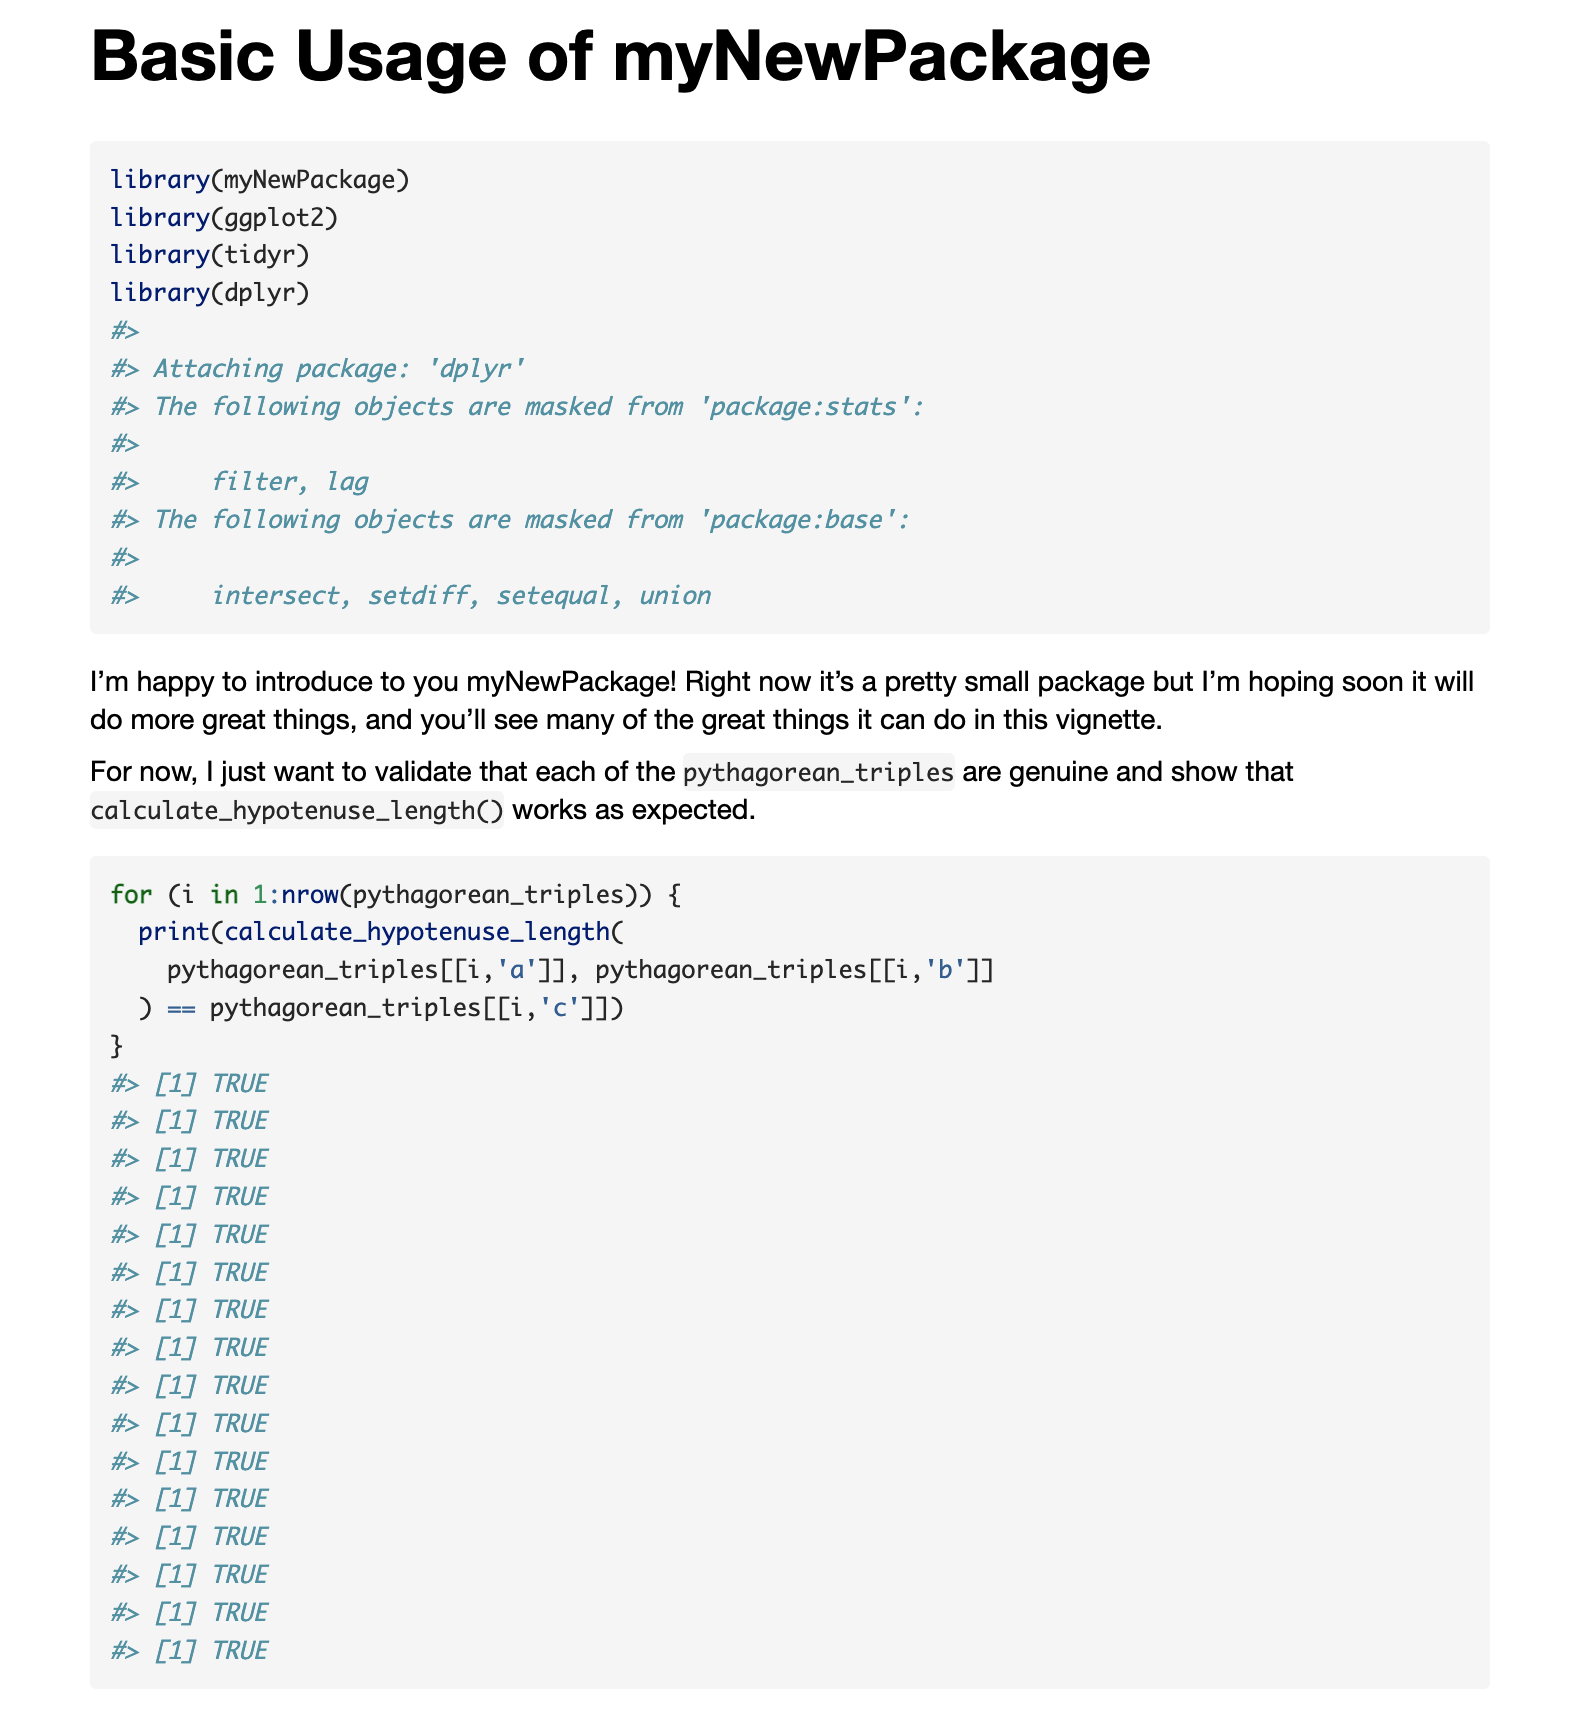
I'm happy to introduce to you myNewPackage! Right now it's a pretty
small package but I'm hoping soon it will do more great things, and you'll
see many of the great things it can do in this vignette.
For now, I just want to validate that each of the `pythagorean_triples`
are genuine and show that `calculate_hypotenuse_length()` works as expected.
```{r}
for (i in 1:nrow(pythagorean_triples)) {
print(calculate_hypotenuse_length(
pythagorean_triples[[i,'a']], pythagorean_triples[[i,'b']]
) == pythagorean_triples[[i,'c']])
}
```
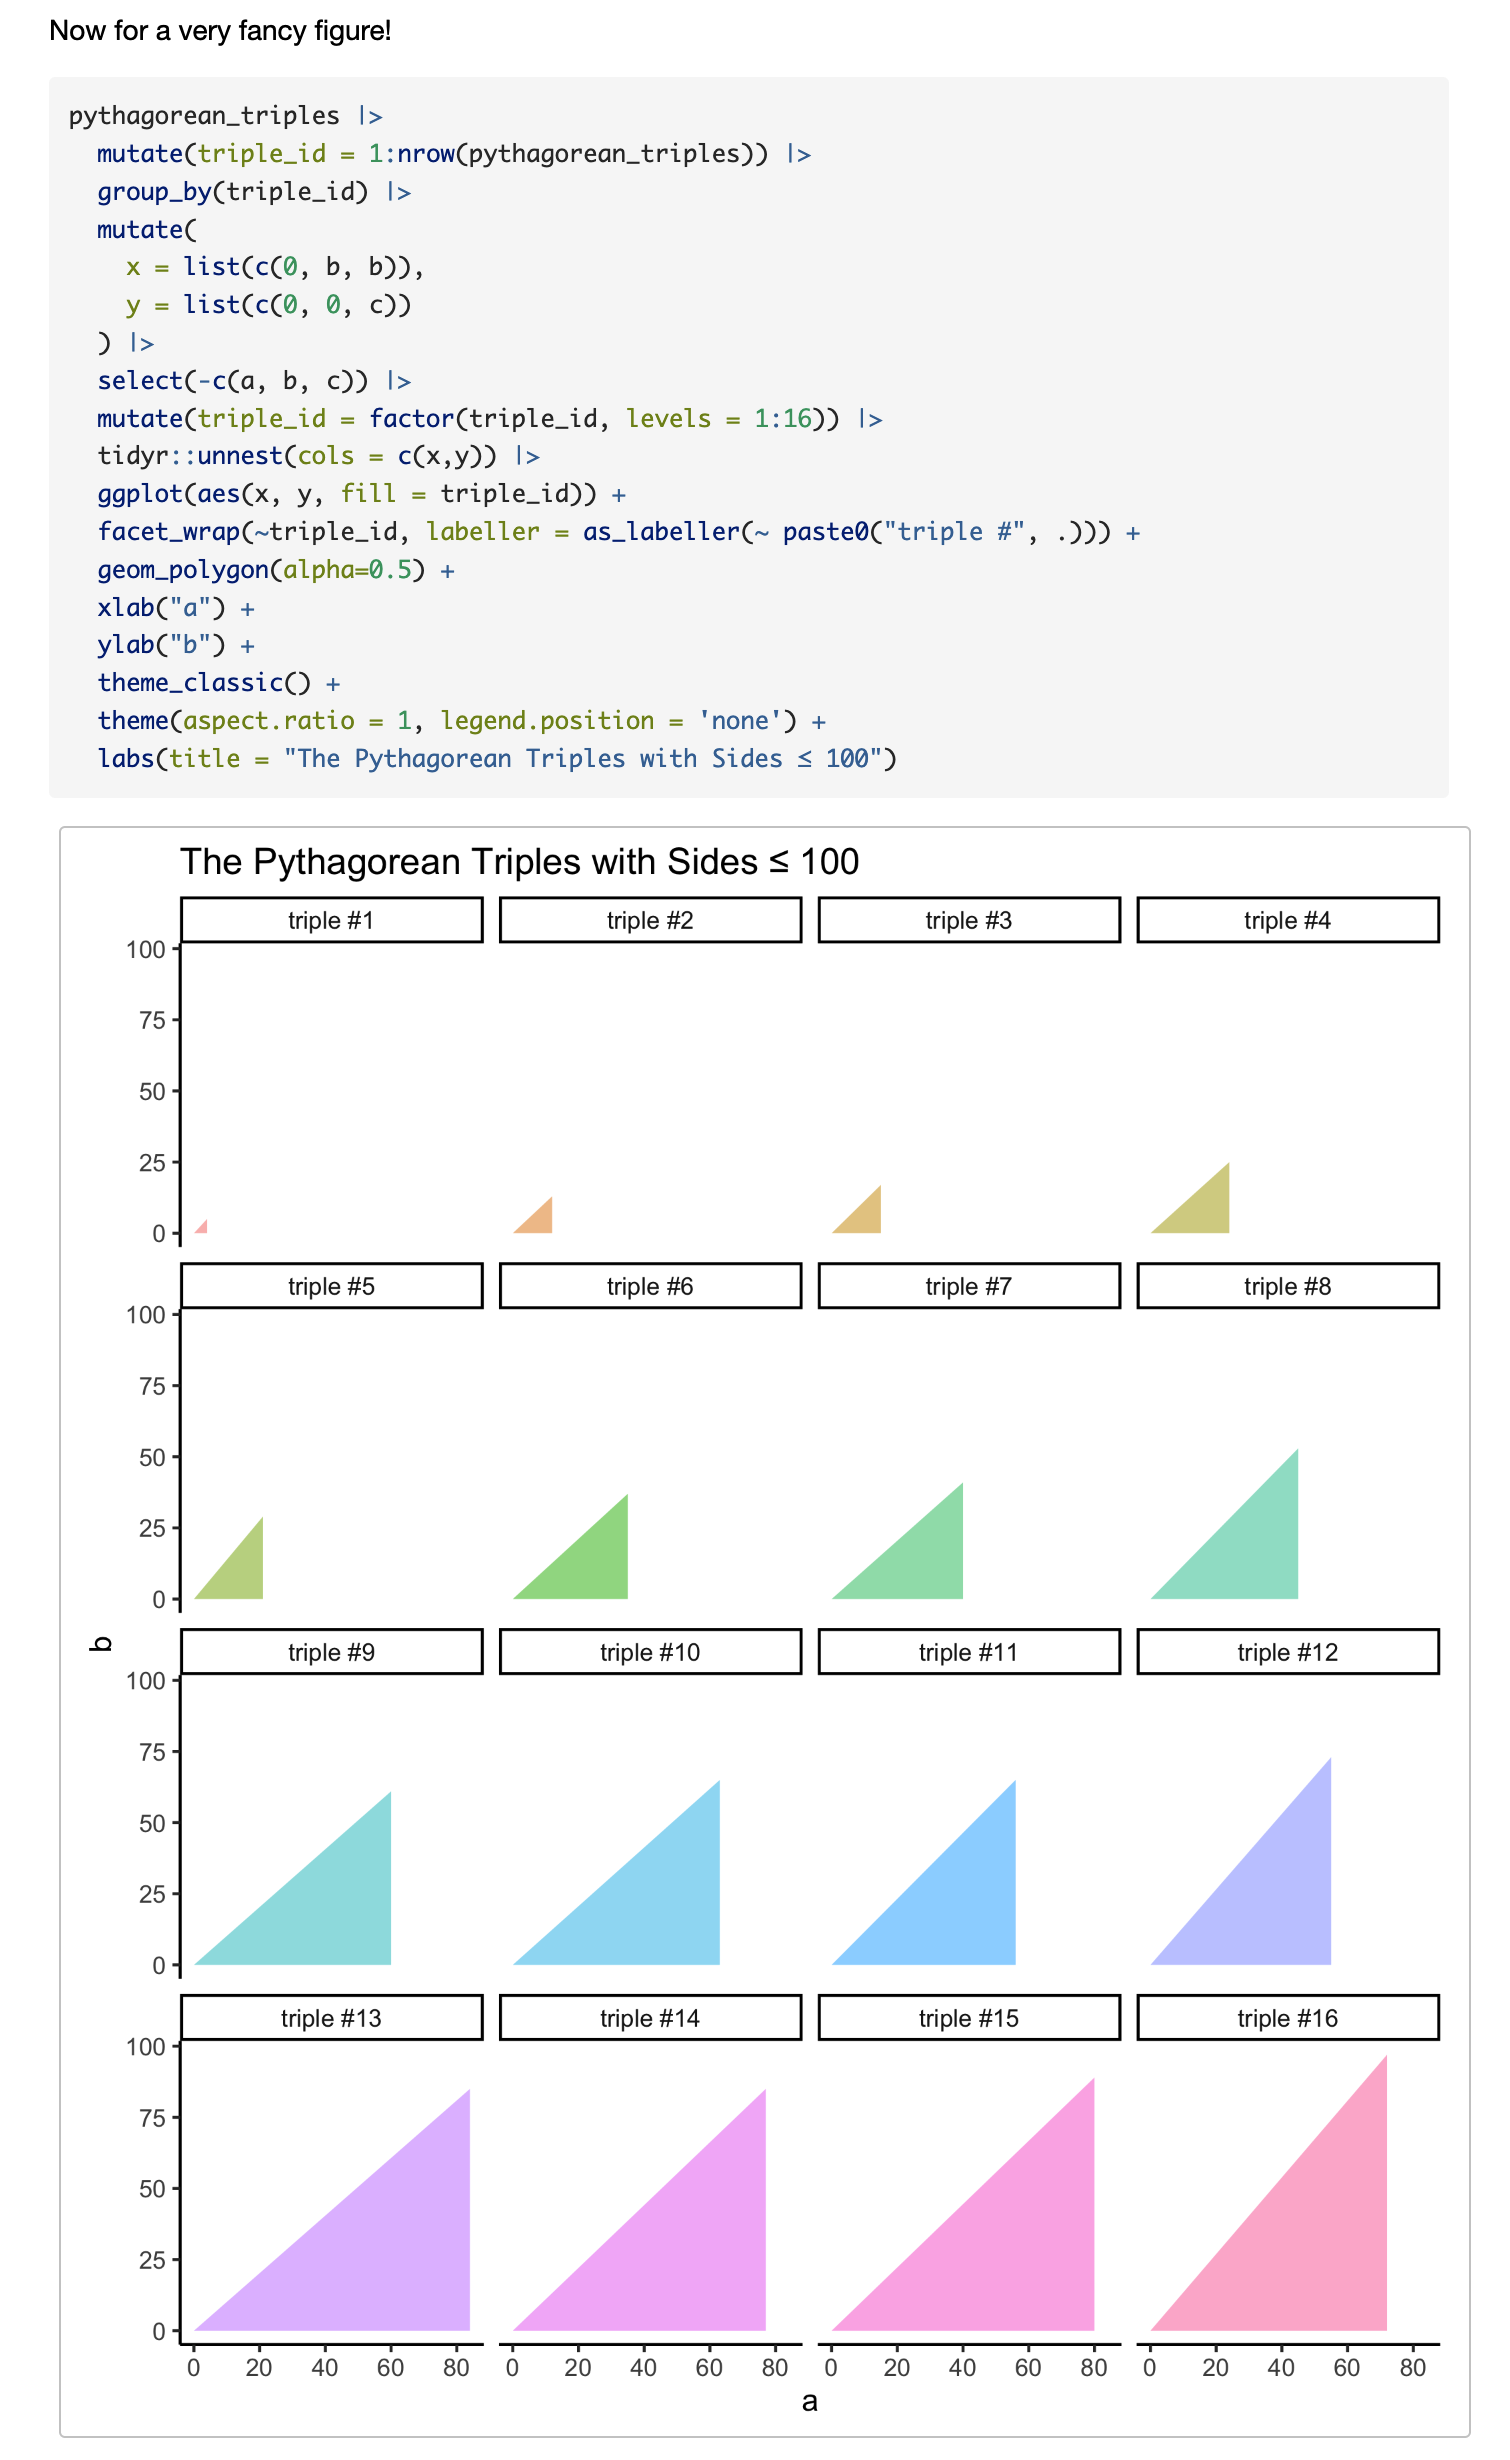
Now for a very fancy figure!
```{r, fig.width = 7, fig.height = 8, dpi=300, out.width='100%'}
pythagorean_triples |>
mutate(triple_id = 1:nrow(pythagorean_triples)) |>
group_by(triple_id) |>
mutate(
x = list(c(0, b, b)),
y = list(c(0, 0, c))
) |>
select(-c(a, b, c)) |>
mutate(triple_id = factor(triple_id, levels = 1:16)) |>
tidyr::unnest(cols = c(x,y)) |>
ggplot(aes(x, y, fill = triple_id)) +
facet_wrap(~triple_id, labeller = as_labeller(~ paste0("triple #", .))) +
geom_polygon(alpha=0.5) +
xlab("a") +
ylab("b") +
theme_classic() +
theme(aspect.ratio = 1, legend.position = 'none') +
labs(title = "The Pythagorean Triples with Sides ≤ 100")
```render the vignette
just like R Markdown you can render a vignette using Cmd+Shift+K or Ctrl+Shift+K or click Knit in your RStudio window.
render the vignette
install with vignettes
adding tests
usethis::use_testthat()
#> ✔ Setting active project to '/Users/cht180/Documents/2023/january/myNewPackage'
#> ✔ Adding 'testthat' to Suggests field in DESCRIPTION
#> ✔ Setting Config/testthat/edition field in DESCRIPTION to '3'
#> ✔ Creating 'tests/testthat/'
#> ✔ Writing 'tests/testthat.R'
#> • Call `use_test()` to initialize a basic test file and open it for editing.
adding tests
add a new file tests/test_pythagorean_triples.R
run tests
some packages you might write
- API wrappers
- Putting a custom ggplot2 theme in a package
- Creating a new geometry for ggplot2
- A particularly method or process you want to make more easily automated
- Data that you think could be a great resource to share
key takeaways
- use R Packages when you want:
- to share functions or datasets in R
- to use automated documentation
- to use automated testing
- take your R Packages to the next level with:
- great testing and documentation including vignettes
- releasing them on GitHub and/or CRAN
- pair them with a great README.md
references
the definitive reference is the R Packages book by Hadley Wickham and Jenny Bryan https://r-pkgs.org
