Principles for Data Analysis from Start to Finish
morals
“Happy families are all alike; every unhappy family is unhappy in its own way.”
—Leo Tolstoy
“Tidy datasets are all alike, but every messy dataset is messy in its own way.”
—Hadley Wickham
data cleaning

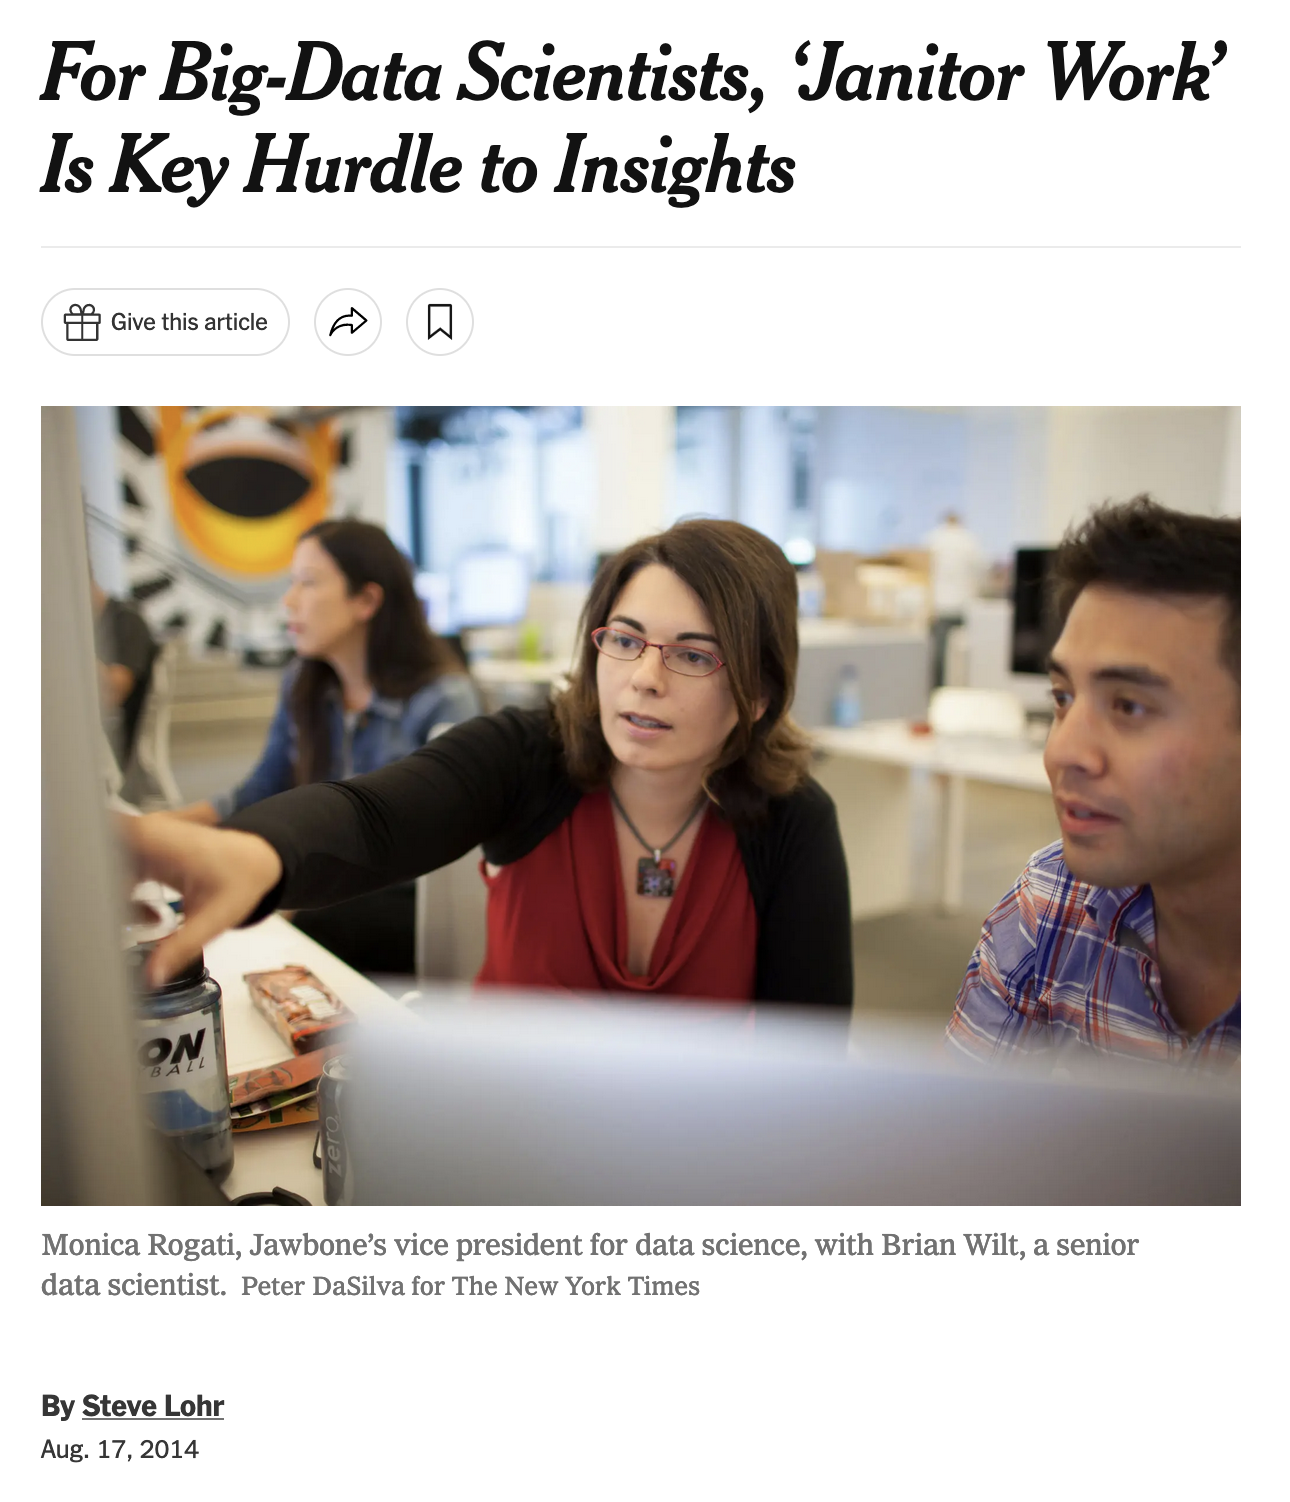
Yet far too much handcrafted work — what data scientists call “data wrangling,” “data munging” and “data janitor work” — is still required. Data scientists, according to interviews and expert estimates, spend from 50 percent to 80 percent of their time mired in this more mundane labor of collecting and preparing unruly digital data, before it can be explored for useful nuggets.
If 80% of the data scientist’s job is data cleaning, perhaps that is the job.
https://twitter.com/ChelseaParlett/status/1221251025983565824Cleaning data 🧼🧽 pic.twitter.com/MMCJkTYmgL
— Chelsea Parlett-Pelleriti (@ChelseaParlett) January 26, 2020
a framework for creating quality

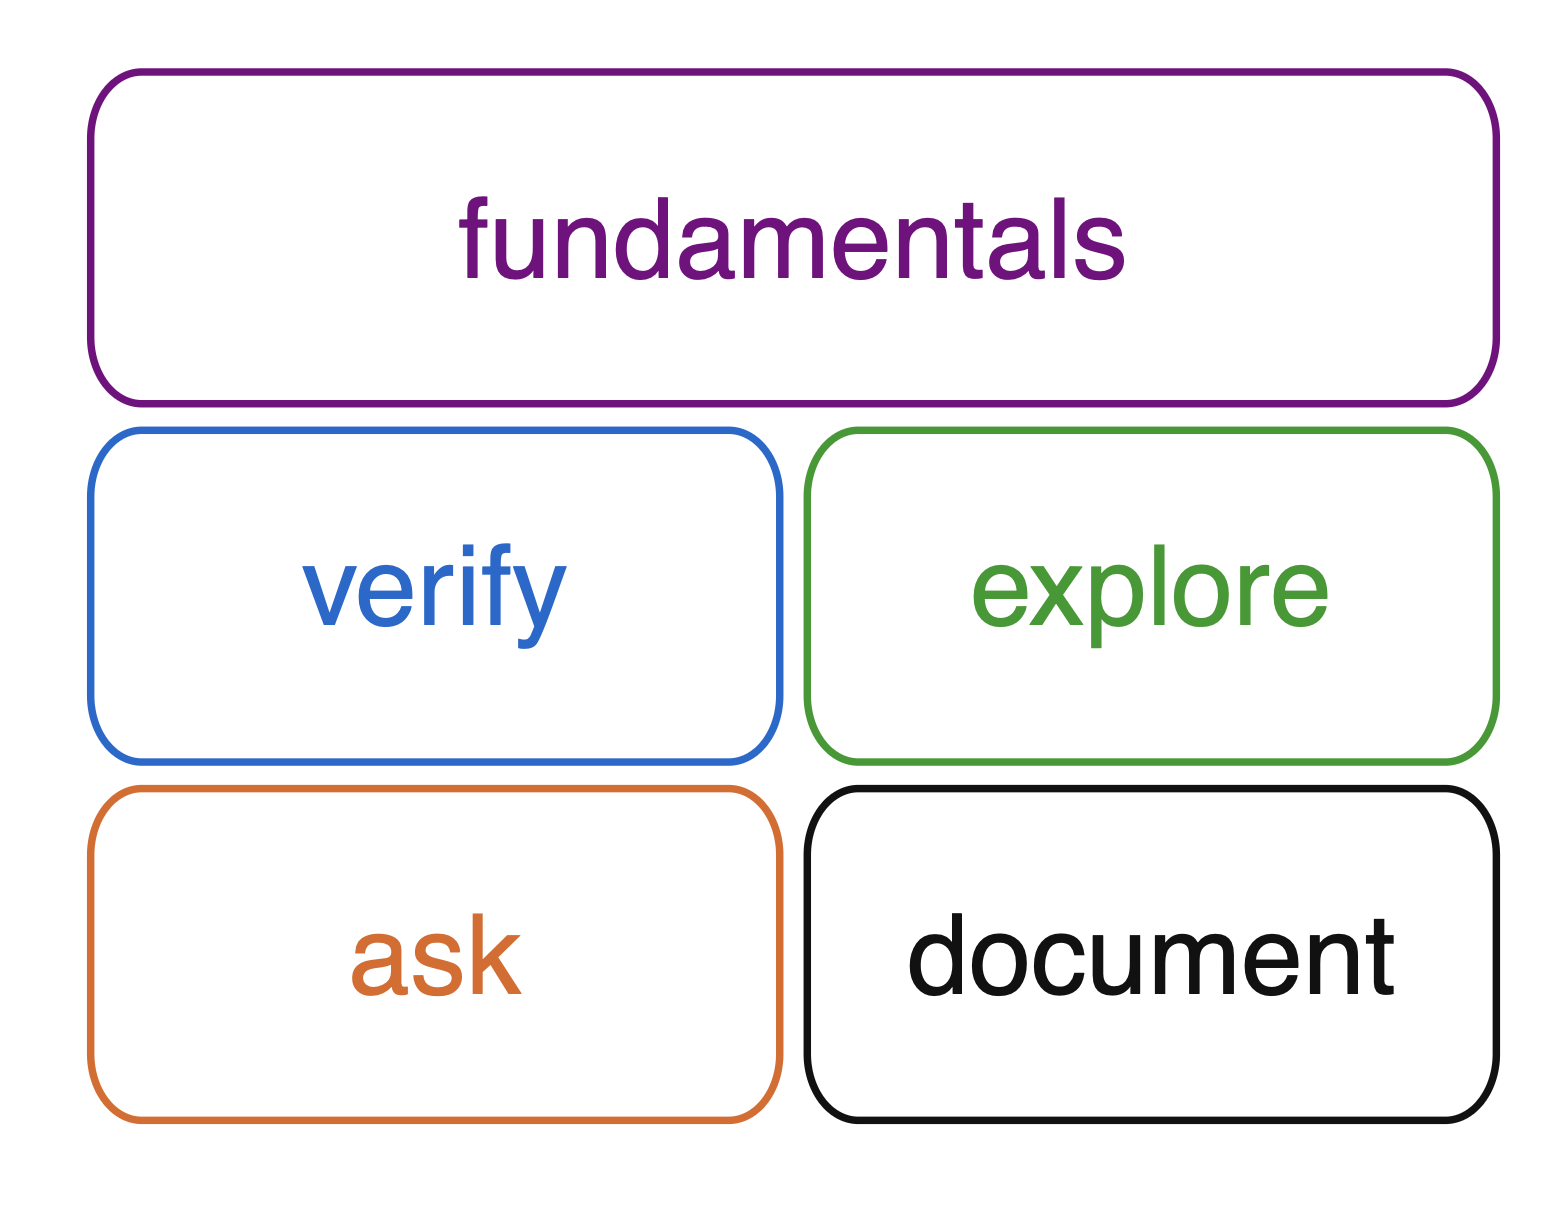
fundamentals
fundamentals
- don’t clean when you’re hungry or tired
- data cleaning requires considerable concentration, and you need to allow sufficient time to do the work. if you’re in a hurry, you’ll miss things.
- don’t trust anyone (even yourself)

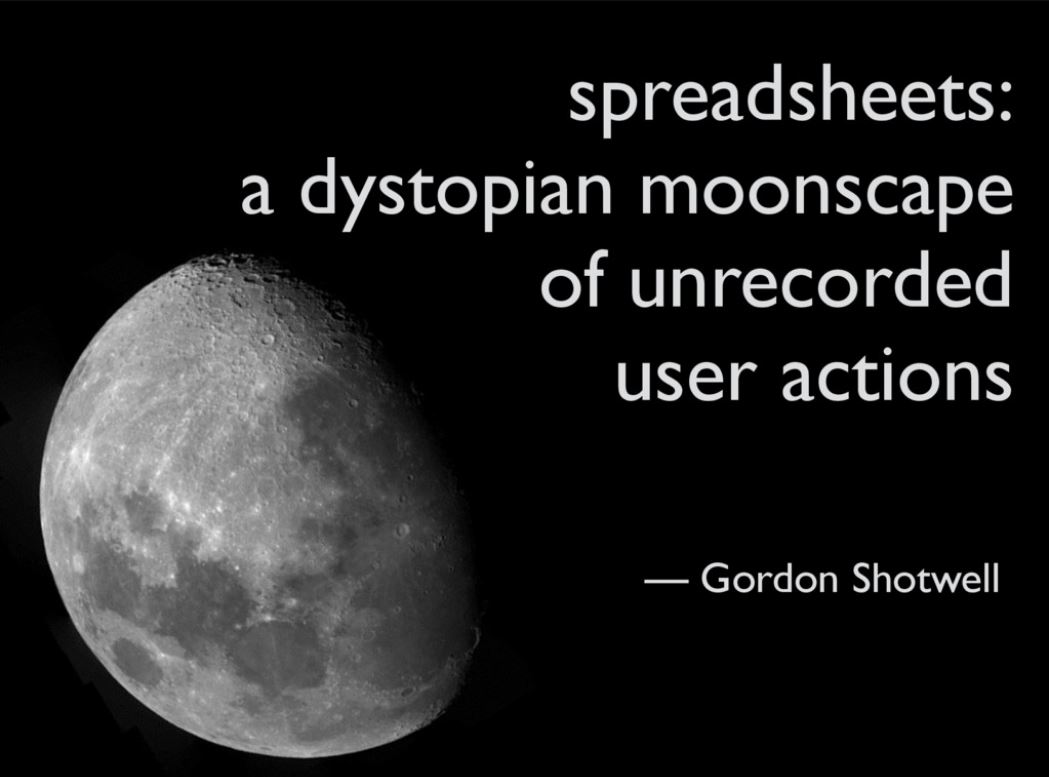
from Jenny Bryan’s talk on spreadsheets https://speakerdeck.com/jennybc/spreadsheets?slide=4

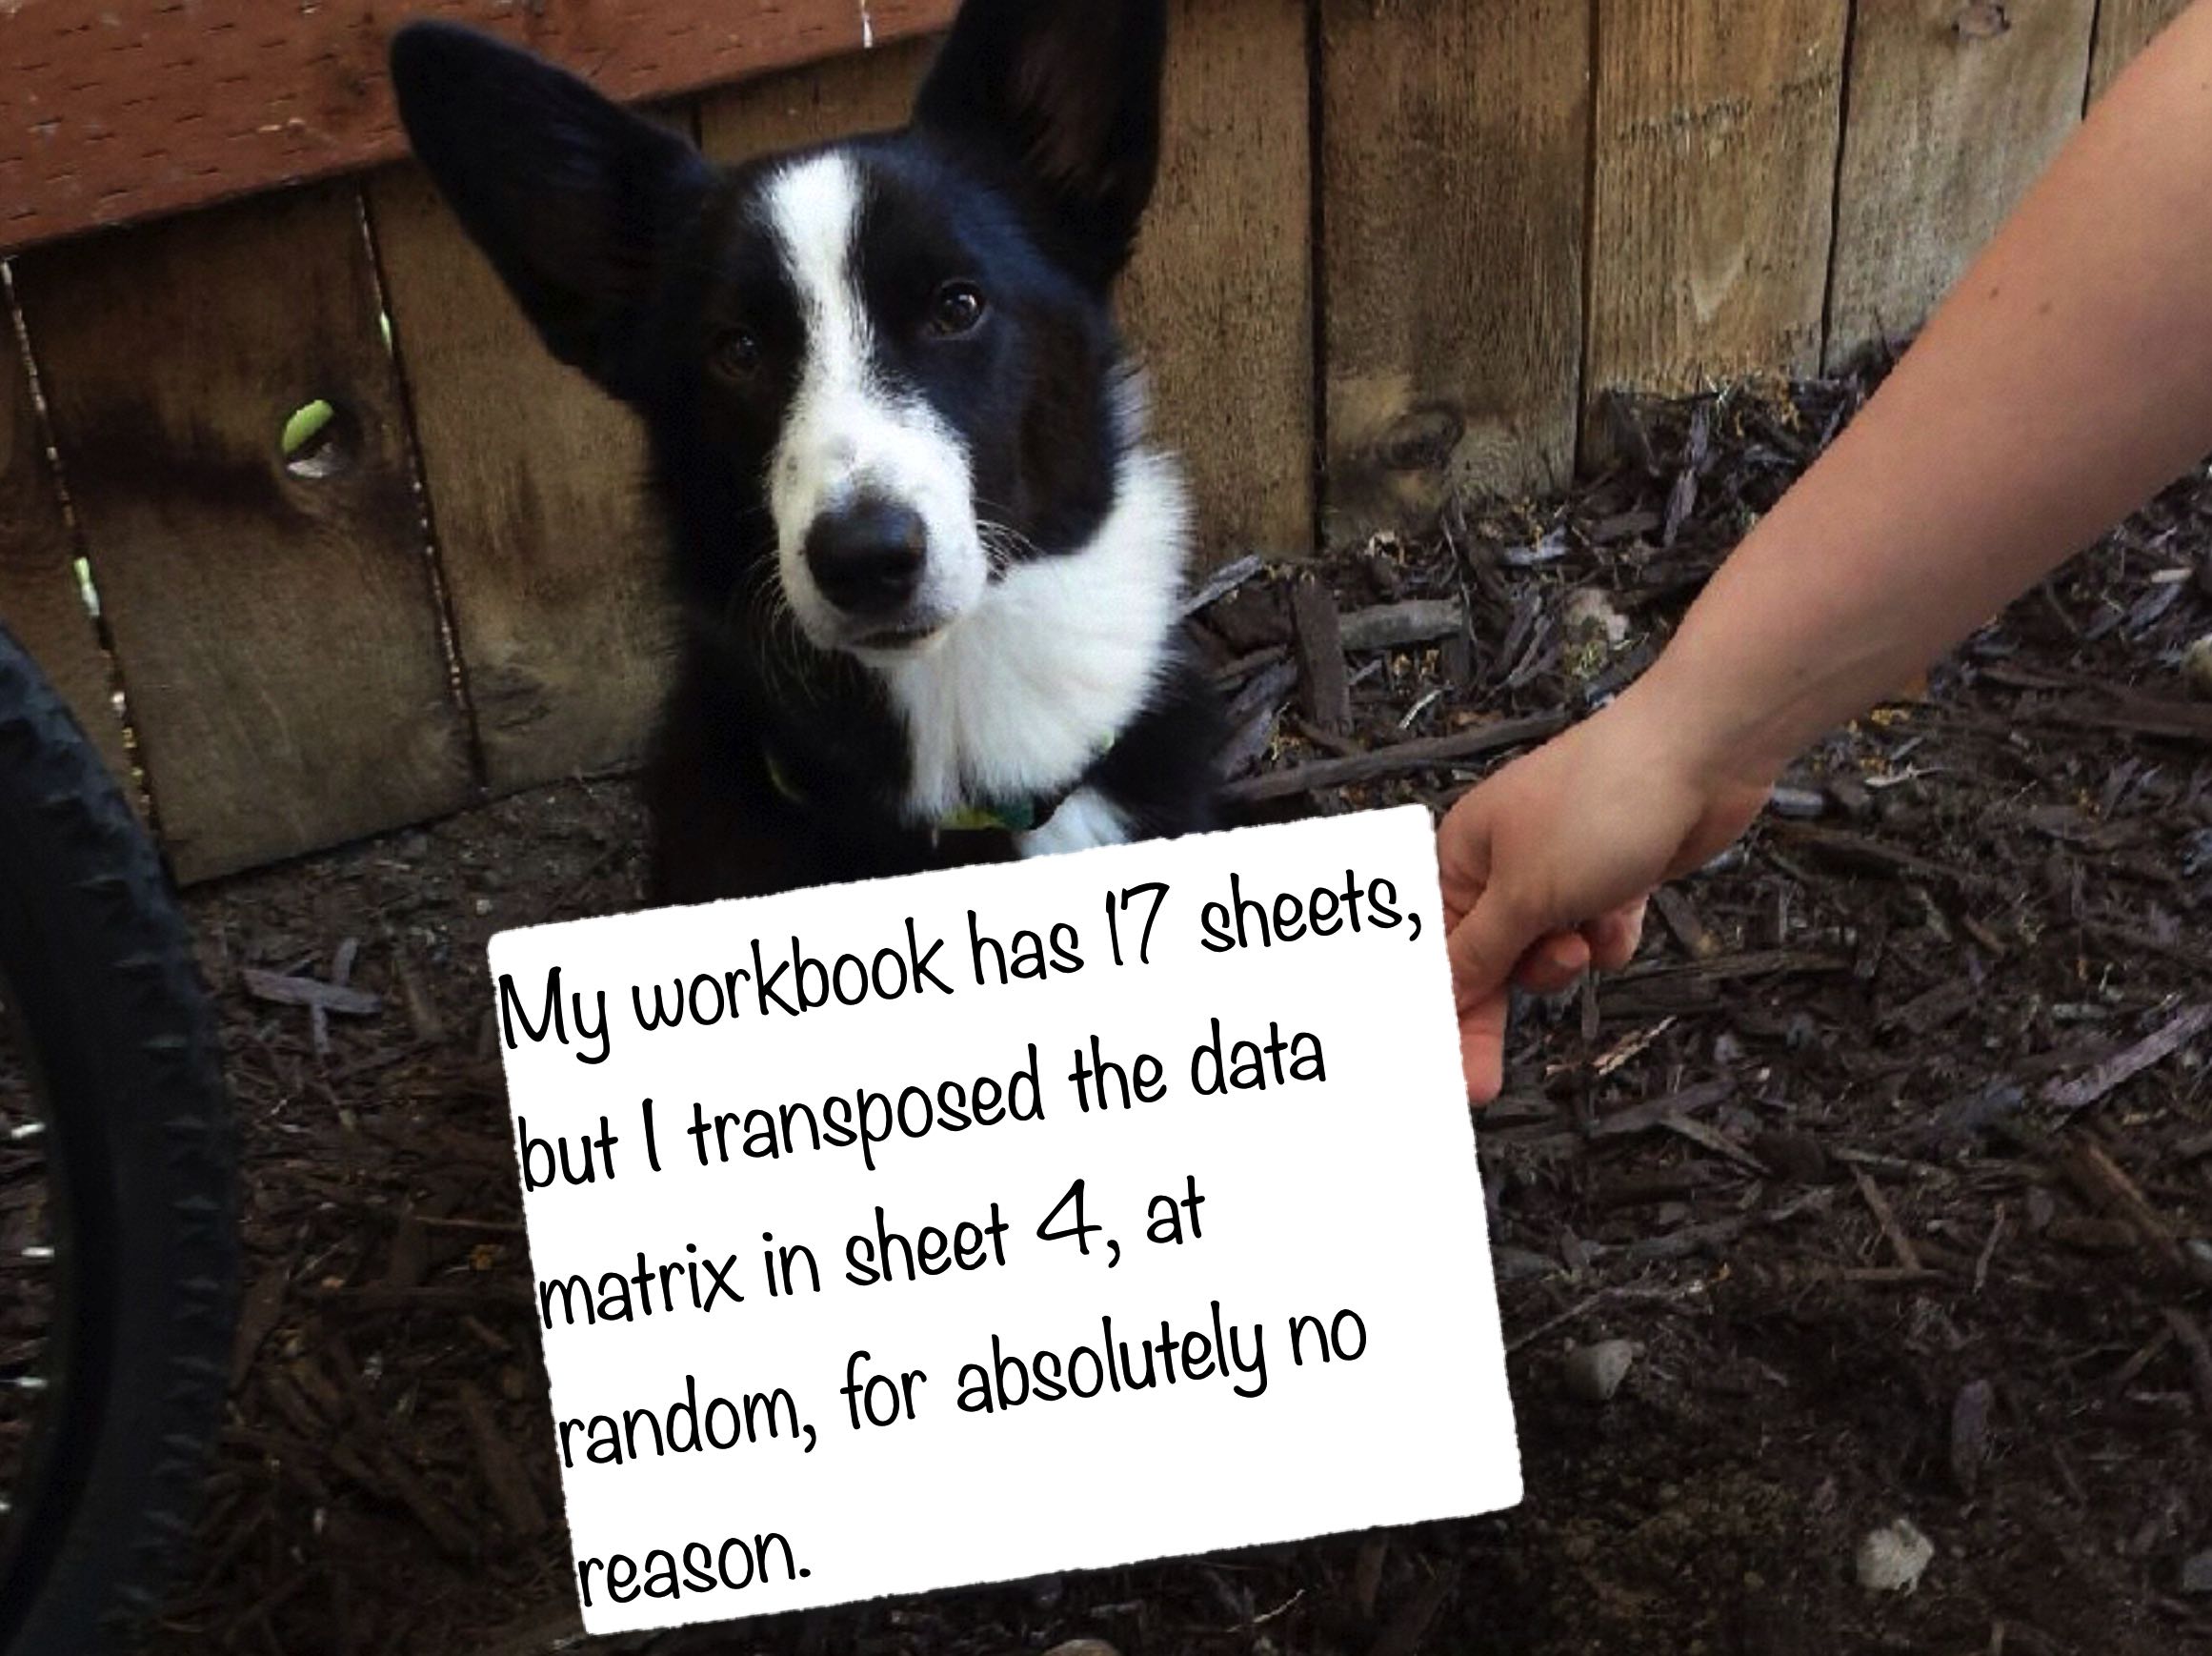
from Jenny Bryan’s talk on spreadsheets https://speakerdeck.com/jennybc/spreadsheets?slide=28
https://twitter.com/JeanVAdams/status/707241263645392896If your collaborator asks, “In what form would you like the data?” you should respond, “In its current form.” via @kwbroman
— Jean Adams (@JeanVAdams) March 8, 2016

fundamentals
- don’t clean when you’re hungry or tired
- data cleaning requires considerable concentration, and you need to allow sufficient time to do the work. if you’re in a hurry, you’ll miss things.
- don’t trust anyone (even yourself)
- think about what might have gone wrong and how it might be revealed
- use care in merging
- dates & categories suck
https://twitter.com/brookLYNevery1/status/954368989181902848Updated Turing Test concept:
— Brooke Watson Madubuonwu (@brookLYNevery1) January 19, 2018
A spreadsheet of dates, hand-entered by interns more than a decade ago, featuring such well-known time formats as "1996ish", "1941/xd01944", "1955?" and "WWII."
I'm not worried about AI until someone shows me the algorithm that can make sense of this. pic.twitter.com/IhzofigX2b
verify
verify
- check that distinct things are distinct
- check that matching things match
- check calculations
- look for other instances of a problem
explore
explore
- make lots of plots
https://twitter.com/patilindrajeets/status/1375006386795524098I am often asked why I insist on complicating a plot by overlaying a violin plot on top of a box plot when the latter already gives a good visual summary of the distribution.
— Indrajeet Patil (इंद्रजीत पाटील) (@patilindrajeets) March 25, 2021
This gif provides a reason.
For a more nuanced argument, see:https://t.co/GhGmqxRoLi#rstats #dataviz pic.twitter.com/Qk1lQMuBJm
explore
- make lots of plots
- look at missing value patterns
- with massive data, make more plots not fewer
- follow up all artifacts
ask
ask
- ask questions
- ask for the primary data
- ask for metadata
- ask why data are missing
document
document
- create checklists & pipelines
- document not just what but why
- expect to recheck
"Writing documentation is all about making future you remember things that present you knows future you will forget" – @data_stephanie #rstats #Rladies
— R-Ladies Chicago (@RLadiesChicago) February 14, 2018
https://twitter.com/RLadiesChicago/status/963576859152744456
Every scientific project will be redone in its entirety about 10-20 times from start to publication. Plan your work flow accordingly, e.g. a piece of R code that takes a data file and produces the analysis and figure/s. Change the data? Just rerun the code.
— Trevor Branch (@TrevorABranch) August 1, 2019
https://twitter.com/TrevorABranch/status/1157006269292507136
in sum
references
- Karl Broman’s presentation on data cleaning https://kbroman.org/Talk_DataCleaning/data_cleaning_notes.pdf